Dashboard
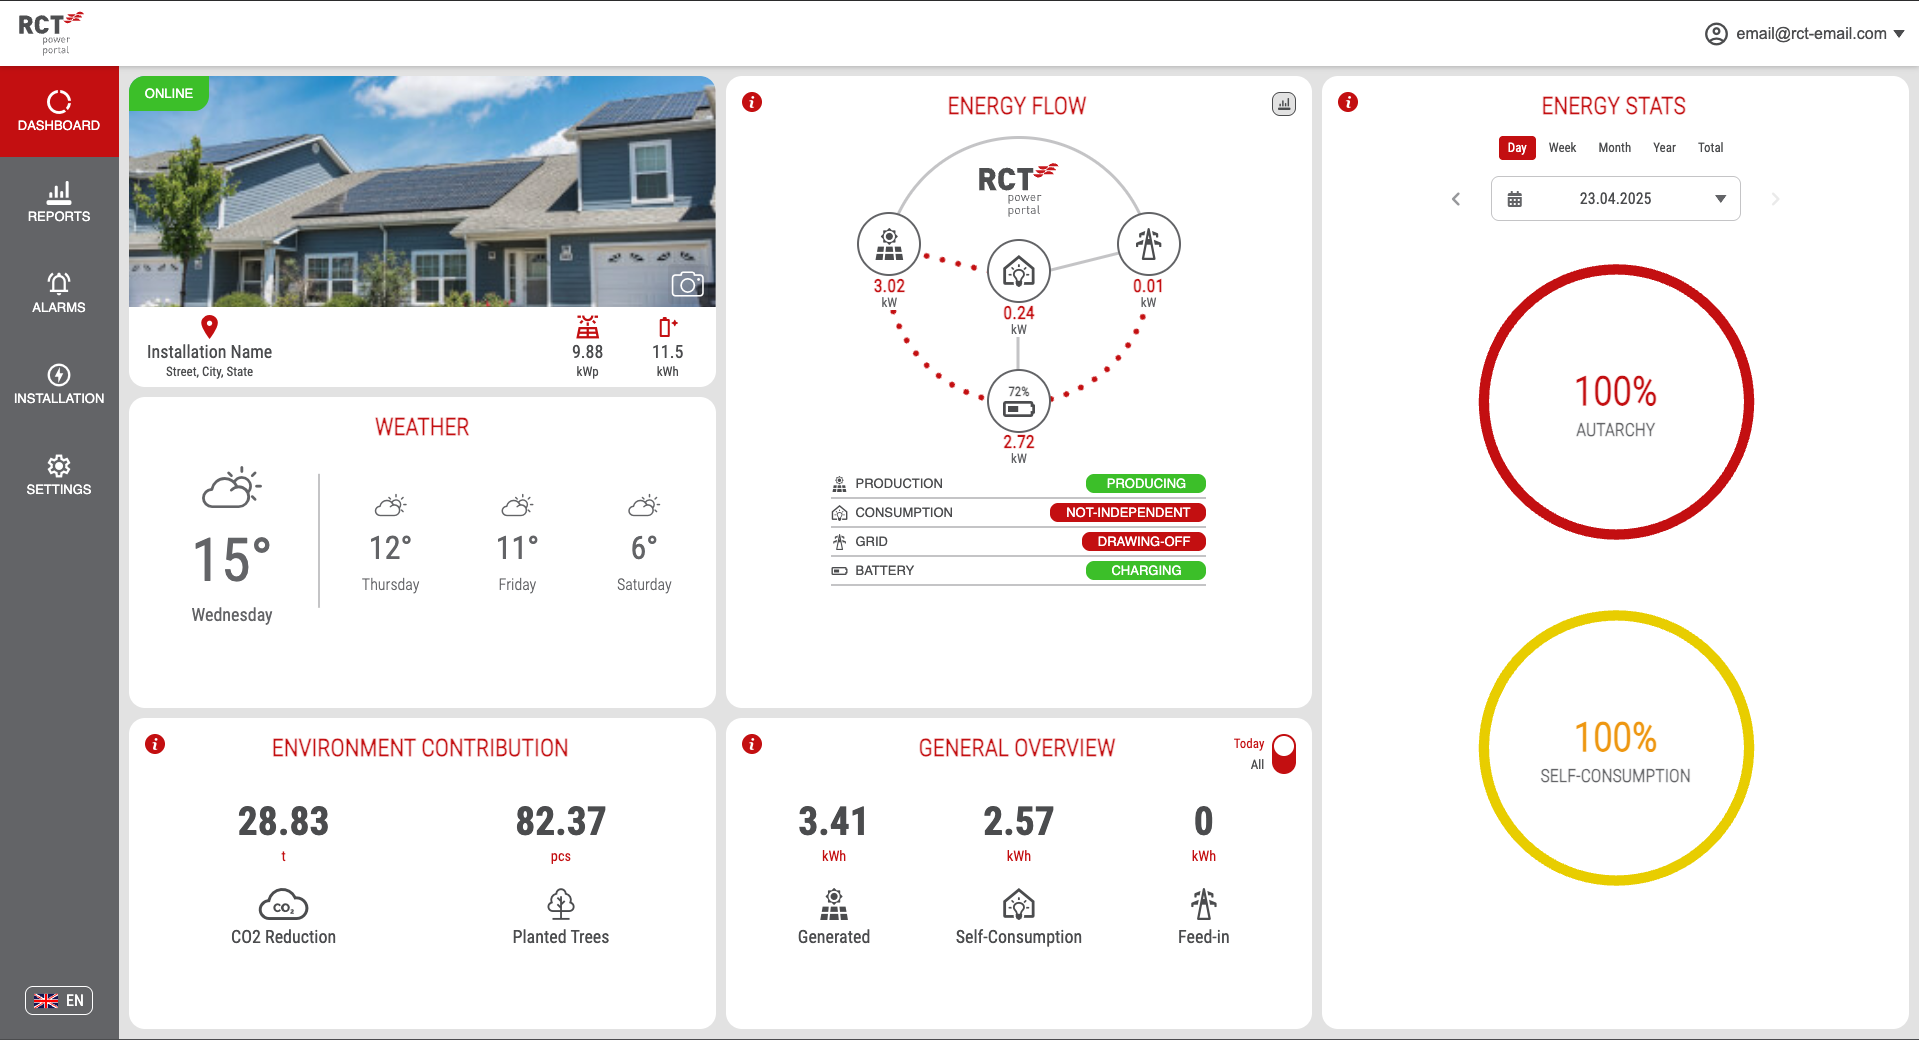
The dashboard is the initial page shown upon logging into the RCT Power Portal, offering a comprehensive overview of your PV system. Here's a detailed breakdown of its key components:
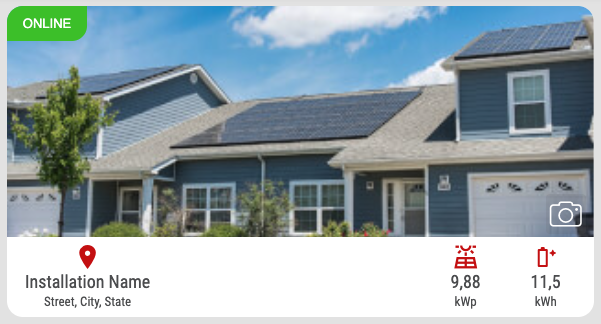
Installation Info
- The default photo can be changed with the help of the camera icon.
- Installation Address
- Installation Status indicates the current status of the plant:
- Online: The inverter is connected to the RCT Power Portal.
- Offline: The inverter is not connected (a connection issue has occurred). If the system is offline, refer to troubleshooting.
- Error: A problem has occurred with the PV system (contact your PV installer).
- Under Repair: The inverter is presently undergoing the claim process. Throughout this period, the system might be temporarily non-operational. For more detailed information, please consult with your PV installer or our support team at support@rct-power.com.
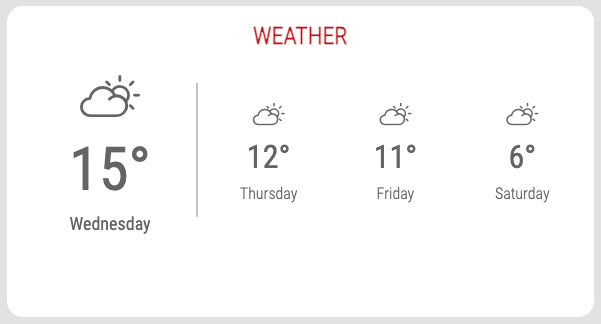
Weather Forecast
- Provides a weather forecast based on the installation address.
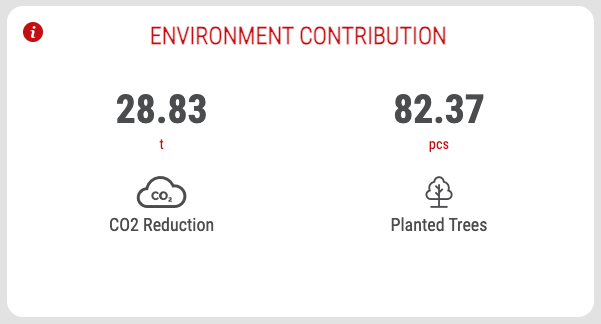
Environment Contribution
- Highlights the contribution of the PV system to the environment.
- CO2 Reduction:
- Represents an approximate equivalent of saved CO2 produced by coal-fired energy plants.
- Planted Trees:
- Shows the approximate number of planted trees necessary to eliminate this CO2 production.
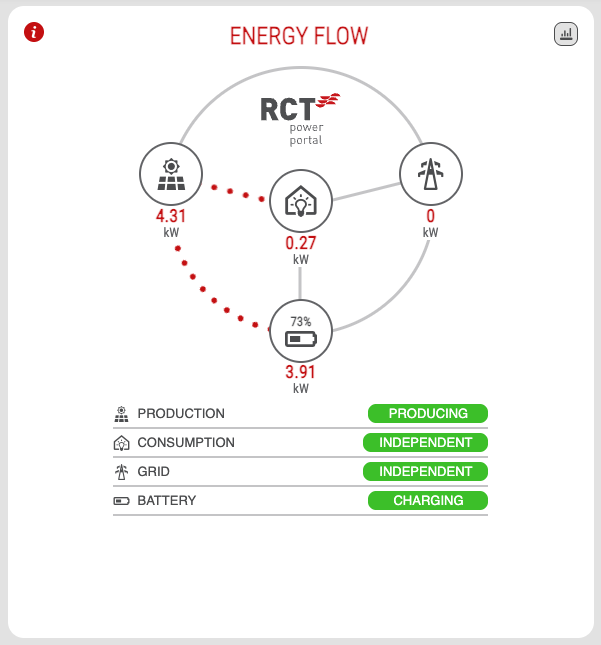
Energy Flow
- Offers a basic overview of the current energy flow.
- Displays actual energy flow directions and power status.
- Contains status for:
- Production
- Consumption
- Grid
- Battery
Power Chart
Clicking the button in the top right corner opens a dialog with a power chart.
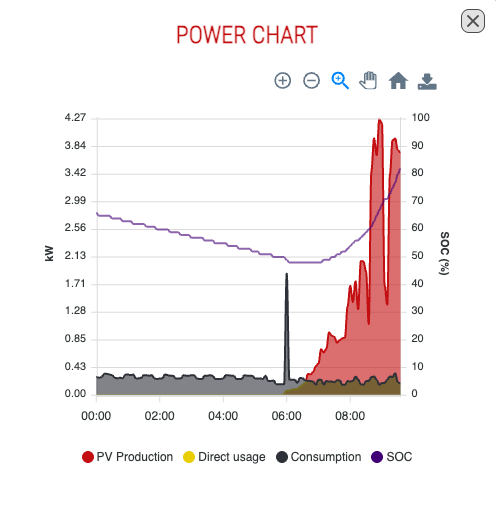
Chart Interaction
Explore and analyze your data effectively with the power chart. The chart toolbar, located within the chart dialog, provides the following features:
- Zoom In/Out: Use the plus and minus buttons to zoom in and out for a closer look at specific time intervals.
- Magnifier Tool: Toggle the magnifier tool for detailed inspection of specific data points.
- Pan Through Data: Utilize the hand tool to pan through the chart, exploring different time periods.
- Reset View: Reset the chart to its original view by clicking the home button.
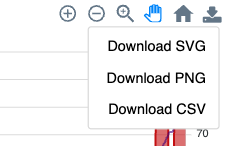
- Download Chart: Download the chart for offline use or sharing in various formats (SVG, PNG and CSV).
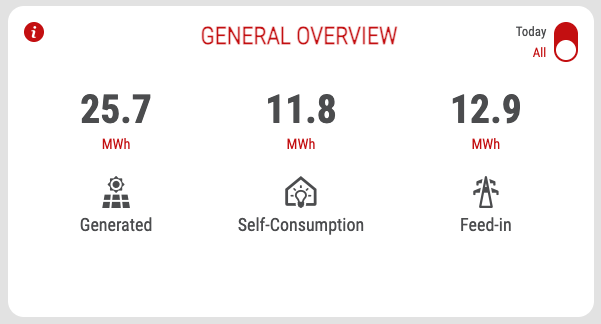
General Overview
- Shows daily and total energy values, including generated energy, consumed energy, and feed-in energy to the grid.
- Displays data for the following values:
- Solar Generated Energy
- Self-consumption
- Feed-in
- Use the Today/All button to switch between today and total values.
- Totals (All selected) provide lifetime totals for all installed/replaced inverters.
Energy Statistics
Gain insights into your PV system's performance with the following key metrics:
-
Autarchy:
- Illustrates the degree of energy independence your household achieves.
-
Self-consumption:
- Displays the proportion of generated energy that is directly consumed by your household.
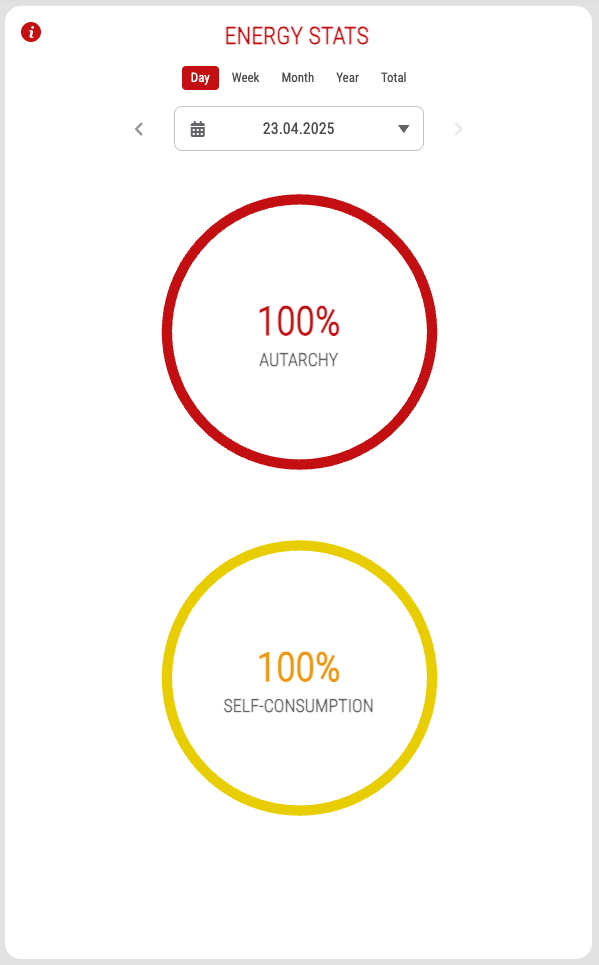
These statistics are presented for a specific period. Use the date/interval buttons to customize your view:
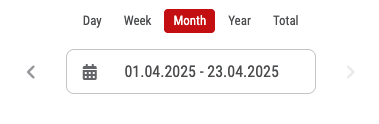
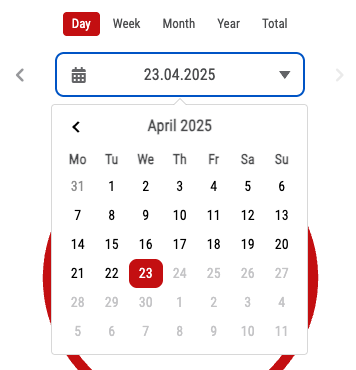
The date/interval selector at the top of this widget provides convenient options:
- Day Interval:
- Choose a specific day using the datetime picker.
- Arrows on both sides of date picker enable you to navigate backward or forward by a day.
-
Week Interval:
- View data from Monday to Sunday or the current day for the ongoing week.
- Navigate through weeks using arrows located on both sides of the Date Picker.
- The Date Picker always shows the selected week.
-
Month Interval:
- Begin with the first day of the month to the end of the month (or the current date for the ongoing month).
- Navigate through months using arrows located on both sides of the Date Picker.
- The Date Picker indicates the currently selected month.
-
Year Interval:
- Commence with the first day of the year to the end of the year (or the current date for the ongoing year).
- Navigate through years using arrows located on both sides of the Date Picker.
- The Date Picker shows the currently selected year.
-
Total Interval:
- Explore complete data without the option to move backward or forward.
After each date selection, the statistics automatically refresh.