Reports
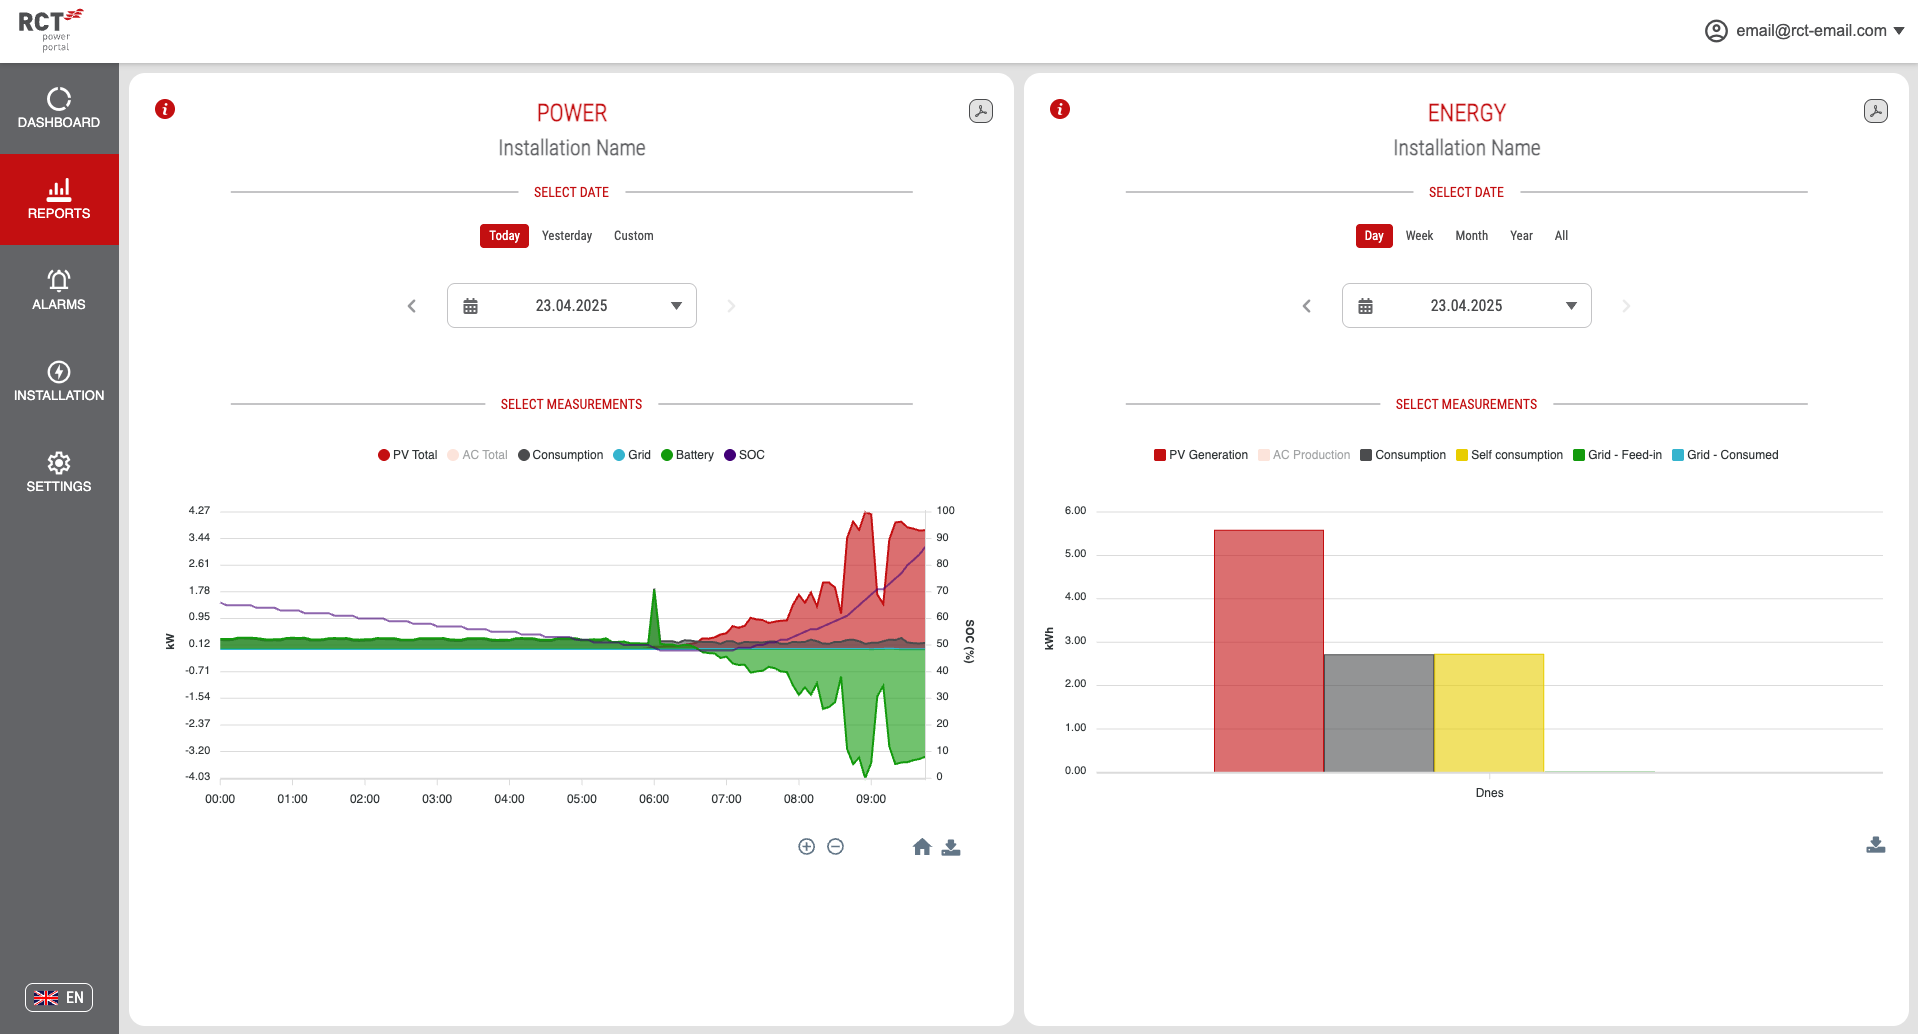
Discover valuable insights into your system's performance through the "Reports" page. Explore the daily performance curve and annual energy production, while accessing preset values for PV generation and household consumption within the portal.
In the upper-right corner of both report sections, find a button to print the currently displayed chart in PDF format.
Power Reports
Examine detailed 5-minute power data:
- PV TOTAL: Total power generated by the PV system
- AC TOTAL: The total power generated by the inverter, ready for use in your home as alternating current (AC).
- CONSUMPTION: Power consumption of the household
- BATTERY: Battery power of charging and discharging (negative = charging, positive = discharging)
- GRID: Power consumed/feed-in to the grid (negative = feed-in, positive = consumed)
- SOC: Battery state of charge (only SOC value using the left vertical % axis)
- EXTERNAL Power: Power from connected slave devices
Date Options
Data is presented for a specific day. Customize your view using date buttons or the datepicker:
- Today: View data for the current day.
- Yesterday: Review data from the previous day.
- Custom: Select a custom date using the calendar.
Navigate by day using arrows on each side of the datepicker. After each date selection, the chart automatically refreshes.
Chart Interaction
When hovering over the chart, you'll see the current values, along with the corresponding date and time.
Effectively explore and analyze power data with the power chart. The chart toolbar, located below the chart, offers the following features:
- Zoom In/Out: Plus and minus buttons for a closer look at specific time intervals.
- Magnifier Tool: Toggle for detailed inspection of specific data points.
- Pan Through Data: Hand tool to explore different time periods.
- Reset View: Reset the chart to its original view.
- Download Chart: Download the chart in SVG, PNG, or CSV formats.
Click on items in the legend to effortlessly hide or reveal specific data points in the chart.
Energy Reports
Review daily calculated total energy values:
- PV GENERATION: The total generated energy by the PV system
- AC TOTAL: The total generated energy by the inverter, ready for use in your home as alternating current (AC).
- CONSUMPTION: Amount of energy consumed by the household
- SELF CONSUMPTION: Amount of generated energy directly consumed by the household
- GRID – FEED-IN: Amount of energy provided to the grid
- GRID – CONSUMED: Amount of energy consumed from the grid
Date Options
Statistics are presented for a specific period. Customize your view using date/interval buttons:
- Day Interval: Select a specific day using the datetime picker. Navigate by day using arrows on both sides of the datepicker.
- Week Interval: View data from Monday to Sunday. Navigate weeks using arrows located on both sides of the Date Picker.
- Month Interval: Begin with the first day of the month to the end of the month. Navigate months using arrows on both sides of the Date Picker.
- Year Interval: Commence with the first day of the year to the end of the year. Navigate years using arrows on both sides of the Date Picker.
- All Interval: Explore complete data without the option to move backward or forward.
After each date selection, the chart automatically refresh.
Chart Interaction
When you hover over a specific bar on the chart, its current value is shown.
The chart toolbar below the chart provides the following features:
- Download Chart: Download the chart in SVG, PNG, or CSV formats.
Switch between total or detailed data using the button on the right from interval buttons (hidden when the day interval is selected). For week and month intervals, detailed data is shown by day; for year and all intervals, data is shown by month.
For a comprehensive yearly overview, choose the "Year Interval" from the selector. Toggle the switch to "Total" and then proceed to export the data by clicking on the download button in the chart toolbar. When you click the download button, a menu will appear, allowing you to select the CSV format for exporting your data.
Click on items in the legend to effortlessly hide or reveal specific data points in the chart.